Flagler’s tourist tax peaked in April of fiscal 2023-24, county report shows
A county analysis of monthly Tourist Development Tax collections shows April 2023-24 as the highest month in the years listed, at $644,498.06.
Tourist Development Tax revenuePart of a story we are following · 1 article · See every update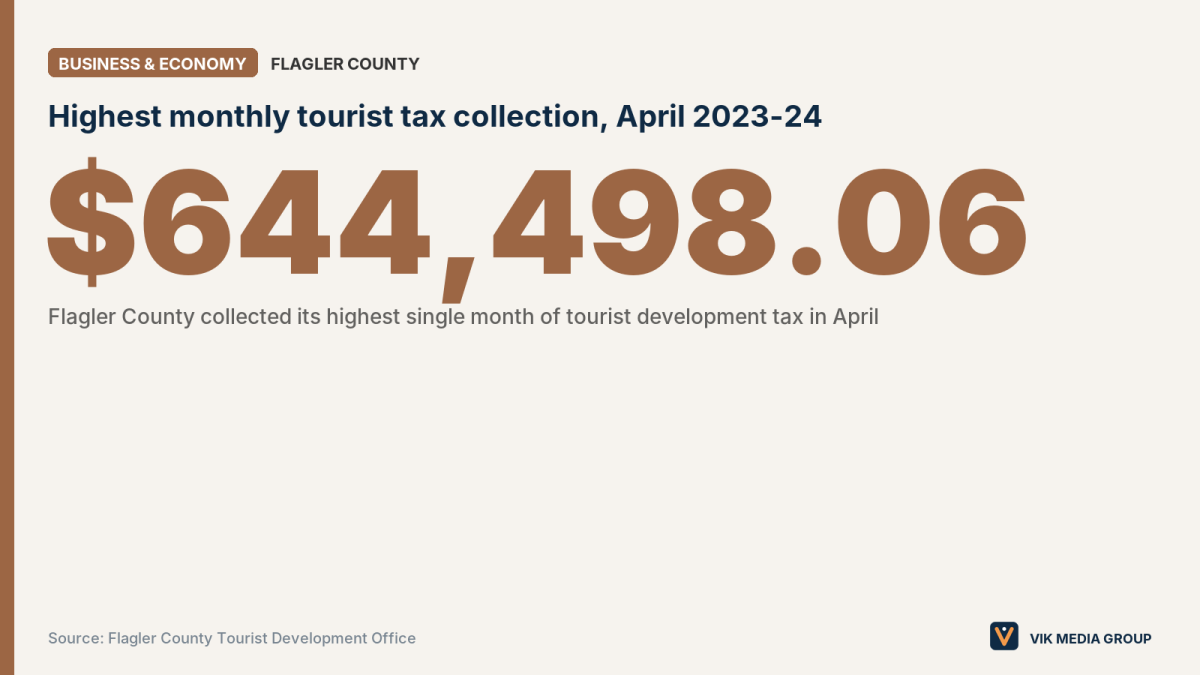
Tourist development tax collections in Flagler County, Florida, reached their highest single month in April of fiscal 2023-24, at $644,498.06, according to a monthly analysis by the county’s Tourist Development Office. The report is undated, and its table covers four fiscal years, from 2020-21 through 2023-24, although its title refers to 2020-21 through 2024-25.
When tourist tax collections peak in Flagler County
April had the highest collections in the report’s table for fiscal 2023-24. The same month was also the highest in each of the other years shown, except 2020-21, when July was higher. The table below lists selected months and the annual totals as they appear in the report.
| Month | 2020-21 | 2021-22 | 2022-23 | 2023-24 |
|---|---|---|---|---|
| October | $216,179.13 | $337,090.11 | $305,578.71 | $312,885.54 |
| January | $205,323.83 | $283,469.85 | $347,294.88 | $297,215.39 |
| April | $440,138.42 | $562,223.43 | $633,440.22 | $644,498.06 |
| May | $330,508.39 | $447,391.80 | $422,224.96 | $354,461.53 |
| Annual total | $3,608,505.41 | $4,432,215.70 | $4,587,725.12 | $4,321,126.12 |
Source: Tourist Development Office, monthly collections table.
How 2023-24 compared with the year before
January 2023-24 collections were $297,215.39, down 14% from $347,294.88 in January 2022-23, according to the report. May 2023-24 collections were $354,461.53, down 16% from $422,224.96 a year earlier.
The report’s totals row lists $4,321,126.12 for 2023-24, a decline of $266,599.00 from $4,587,725.12 in 2022-23. The report’s own percentage for that change does not match its totals, so this story uses only the dollar figures.
The report’s text also lists Hurricane Ian (September 2022), Hurricane Nicole (November 2022) and Hurricane Helene (September 2024). It does not explain how those storms relate to the figures.
What the report does not show
The report’s title refers to fiscal 2024-25, but the table in the copy reviewed for this story ends with 2023-24. The report does not give a publication date.
Live in the Historic Coast? Write for us as a Community Contributor and share what you see in your town.
Questions and answers
- When were tourist tax collections highest in Flagler County?
- According to the Flagler County Tourist Development Office's monthly analysis, April 2023-24 was the highest single month in the years shown, at $644,498.06.
- How much tourist development tax did Flagler County collect in fiscal 2023-24?
- The report's totals row lists $4,321,126.12 for fiscal 2023-24, down $266,599.00 from $4,587,725.12 in 2022-23. The report's table does not include fiscal 2024-25.